In the past few months, I’ve been stress-testing how far AI coding agents can take us when building real, production-grade distributed systems.
The result: a Rust-based multi-Paxos consensus engine that not only implements all the features of Azure’s Replicated State Library (RSL) [1] — which underpins most major Azure services — but also modernizes it for today’s hardware.
The entire project took me ~3 months, with 100K lines of Rust code written in ~4 weeks and performance optimization from 23K operations/sec to 300K ops/sec achieved in ~3 weeks.
Besides unprecedented productivity, I discovered several techniques that were instrumental. This post shares my most valuable learnings on: ensuring correctness with code contracts, applying lightweight spec-driven development, and pursuing aggressive performance optimization — plus my wish list for the future of AI-assisted coding.
Why Modernize RSL?
Azure’s RSL implements the multi-Paxos consensus protocol and forms the backbone of replication in many Azure services. However, RSL was written more than a decade ago. While robust, it hasn’t evolved to match modern hardware and workloads.
There are three key gaps motivated this project:
- No pipelining: When a vote is in flight, new requests must wait, inflating latency.
- No NVM support: Non-volatile memory is now common in Azure datacenters and can drastically reduce commit time.
- Limited hardware awareness: RSL wasn’t built to leverage RDMA, which is now pervasive in Azure data centers.
Removing these limitations could unlock significantly lower latency and higher throughput — critical for modern cloud workloads and AI-driven services.
Given my interest in Rust and AI-accelerated development, I set out to build a modern RSL equivalent from scratch.
Massive Productivity Boost
In roughly six weeks, I’ve driven AI and implemented over 130K lines of Rust code covering the full feature set of RSL, including multi-Paxos, leader election, log replication, snapshotting, and configuration changes.
I utilized many available AI coding agents: GitHub Copilot, Claude Code, Codex, Augment Code, Kiro, and Trae. My workflow evolved quickly, but today my main drivers are Claude Code and Codex CLI, with VS Code handling diffs and minor edits.
I’ve found that coding from the CLI creates a perfect asynchronous flow that maximizes my productivity. I also discovered a simple psychological trick:
I pay $100/month for Anthropic’s max plan. This became a forcing function — if I don’t kick off a coding task with Claude before bed, I feel like I’m wasting money.
When Codex CLI arrived, I added a second ChatGPT Plus subscription to handle rate limits — one subscription for Monday–Wednesday, the other for Thursday–Sunday.
Code Contracts — By AI, For AI
The question I get most often is: How can AI possibly implement something as complex as Paxos correctly?
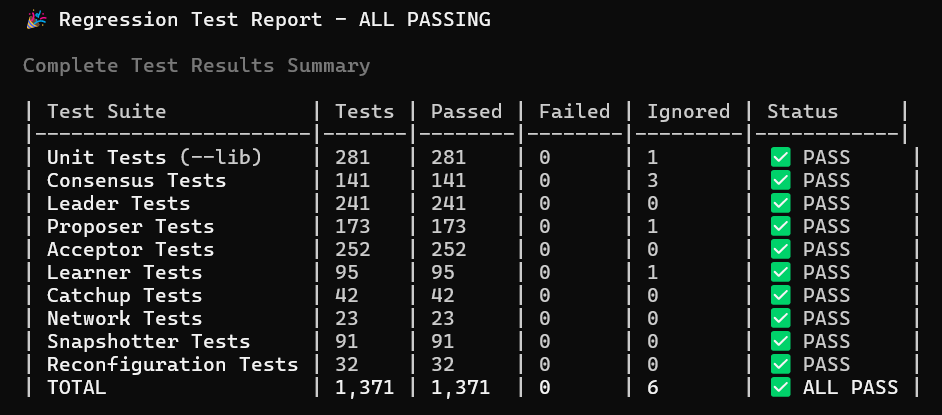
Testing is the first layer of defense. My system now includes 1,300+ tests — from unit tests to minimal integration tests (e.g., proposer + acceptor only), all the way to multi-replica full integration tests with injected failures. See the project status.
But the real breakthrough came from AI-driven code contracts.
Code contracts specify preconditions, postconditions, and invariants for critical functions. These contracts are converted into runtime asserts during testing but can be disabled in production builds for performance. While I started using this approach long ago with .NET [2], AI has made contracts vastly more powerful.
Here’s how I apply them at three levels:
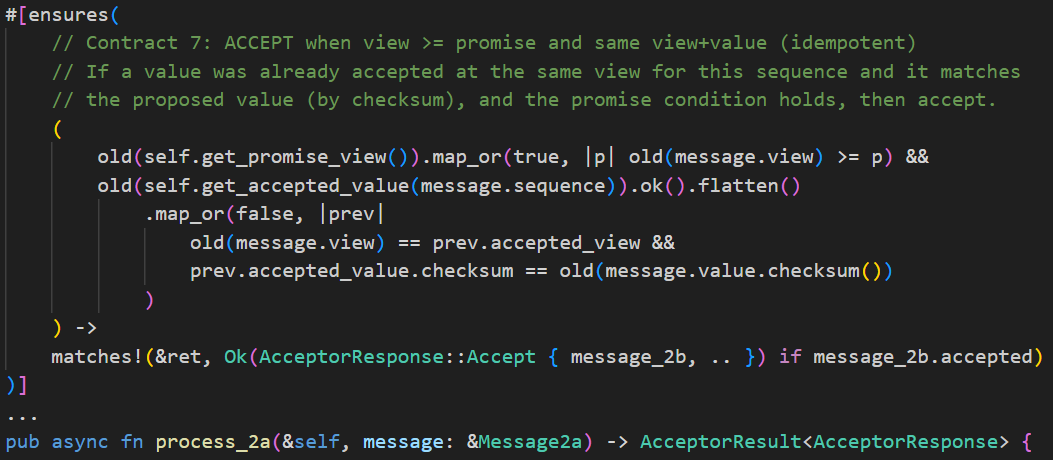
1. Ask AI to write contracts. Opus 4.1 writes good contracts, but GPT-5 High writes excellent ones. I focus on reviewing and refining. For example, the process_2a method (handling phase 2a messages in Paxos) has 16 contracts, including this one:
2. Generate tests from contracts. Once contracts are defined, I ask AI to create targeted test cases for each post-condition. It excels at this, generating meaningful edge cases automatically.
3. Property-based tests for contracts. This is my favorite. AI translates contracts into property-based tests, exploring a vast space of randomized inputs. Any contract violation triggers a panic, exposing deep bugs early.
For instance, one AI-generated contract found a subtle Paxos safety violation:
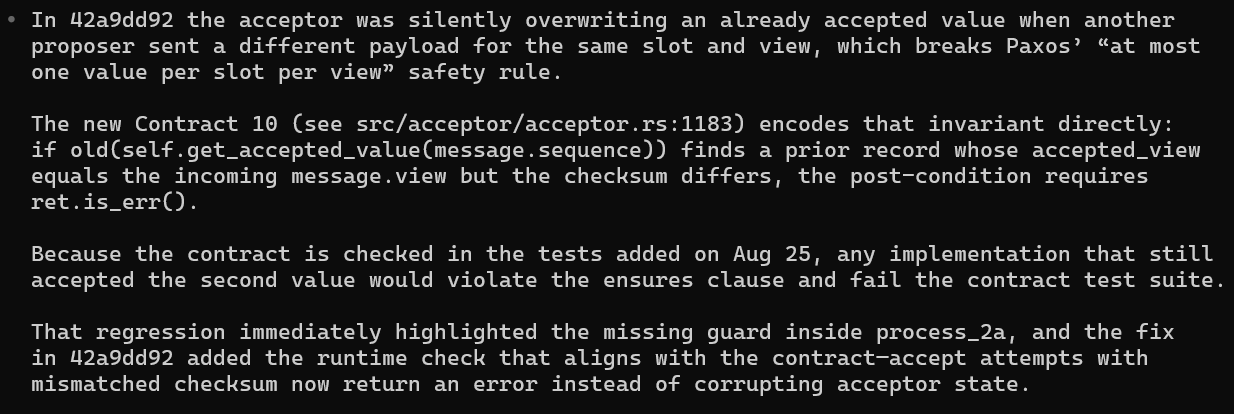
That single contract saved what could have been a serious replication consistency issue — well before it ever hits production.
Lightweight Spec-Driven Development
I’ve tried various Spec-Driven Development (SDD) tools. In fact, the earlier components (such as leader election, proposer, acceptor, and learner) were all implemented following a rigid SDD approach. I would start with a requirement markdown, turn it into a design markdown, and then a task list markdown. However, I gradually found this process too rigid; making changes along the way and ensuring all documents remained consistent became a headache.
I’ve now switched to a more lightweight approach. When I work on a feature (e.g., snapshotting), I use /specify from spec kit [3] to generate a spec markdown. This spec consists of a few user stories and acceptance criteria.
Here is an example user story for snapshotting:
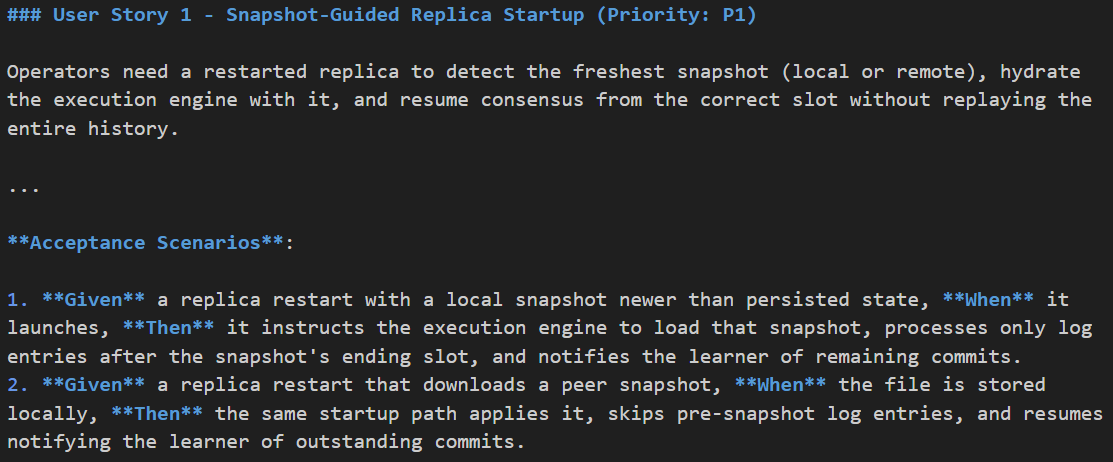
I then use /clarify to ask the AI to self-critique and improve the user stories and criteria. I also ask it to suggest additional user stories not covered in the initial spec. I spend the majority of my time here.
Once satisfied, I jump into plan mode and ask AI to generate a plan for a specific user story. Given the capability of today’s AI coding agents, a single user story feels like the “sweet spot” unit of work they can manage effectively. Along the way, we may discover additions or tweaks, which are easy to handle in the same coding session (agents might compress context, but I typically don’t worry about losing too much).
Here is a sample /clarify interaction for configuration changes:
● Question 4: Starting Slot Determination

  How should the starting slot for the new configuration be determined relative to the ending slot?

  Recommended: Option A - Always exactly ending_slot + 1

  This ensures no gaps in the slot sequence and maintains continuity between configurations, preventing any slots from being orphaned or unassigned.

  | Option | Description                                                    |
  |--------|----------------------------------------------------------------|
  | A      | Always exactly ending_slot + 1                                 |
  | B      | Allow operator to specify any value > ending_slot              |
  | C      | Next multiple of 1000 after ending_slot for cleaner boundaries |
  | D      | Same as ending_slot (both configs share final slot)            |

  You can reply with the option letter (e.g., "A"), accept the recommendation by saying "yes" or "recommended", or provide your own short answer.
Performance optimization is where AI really shines. After ensuring initial correctness, I spent about three weeks purely on throughput tuning — and AI became my co-pilot in performance engineering.
Through iterative cycles, we boosted throughput from ~23K ops/sec to ~300K ops/sec on a single laptop.
Here’s the loop I followed repeatedly:
- Ask AI to instrument latency metrics across all code paths.
- Run performance tests and output trace logs.
- Let AI analyze latency breakdowns (it writes Python scripts to calculate quantiles and identify bottlenecks).
- Ask AI to propose optimizations, implement one, re-measure, and repeat.
This process surfaced insights I might have missed — for example, lock contention on async paths, redundant memory copies, and unnecessary task spawns.
Rust’s safety model made it easy to push these optimizations confidently. Key gains came from minimizing allocations, applying zero-copy techniques, avoiding locks, and selectively removing async overhead. Each improvement felt like peeling another layer of latency off a high-performance engine — without fear of corrupting memory.
Wish List for AI-Assisted Coding
Reflecting on my journey, I keep wondering where AI could deliver even more value. Here are some items on my wish list:
End-to-End User Story Execution: I still prefer to define the user stories myself. As an architect, I feel I have a better sense of what I’m building and how I’d like to build it. However, the delivery of a perfect execution is something I believe AI can handle increasingly well. Today, I still have to spend a fair amount of time steering the AI — telling it to continue when it pauses, suggesting refactoring, reviewing test coverage, and suggesting additional tests. I would prefer the AI take more autonomy to drive this end-to-end.
Automated Contract Workflows: The flow of applying contracts seems largely automatable. While I’d still want to review the contracts and offer suggestions, I’d like the AI to drive the rest: generating tests based on contracts, debugging individual test cases, ensuring consistency between tests and contracts, and writing property-based tests. When a test fails, I’d like the AI to debug and fix trivial issues automatically, only notifying me when there are genuine correctness issues in the contracts or the implementation.
Autonomous Performance Optimization: Performance tuning seems ripe for more automation. Much of what I’ve done is repetitive and parallelizable. Projects like AlphaEvolve (or OpenEvolve) show promise in this direction. Ideally, I would suggest potential optimization avenues, and the AI would execute the experiments completely by itself. While current tools handle small bodies of code, applying similar techniques to larger codebases with end-to-end measurement seems feasible.
Appendix: Project Status
The seed of the project is an elegant design markdown authored by Jay Lorch [4] from Microsoft Research. This design greatly simplifies all the components in multi-Paxos, making it easier to implement and reason about.
So far, 2 out of the 3 RSL limitations have been addressed: pipelining and NVM support (Jay integrated the fully verified persistence log for NVM which was published in the PoWER Never Corrupts paper [5] at OSDI 2025). The RDMA support is still TBD.
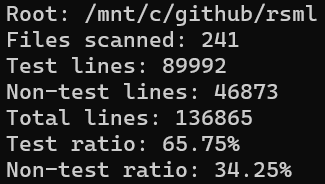
To date, the project has grown to over 130K lines of Rust code, with 1,300+ tests accounting for more than 65% of the codebase.
Adblock test (Why?)